The Ultimate List Of Famous TikTok Girls (2025): Who’s On Top, How They Grow & How Much They Earn?
Subhasree Nag, 2 days ago

Subhasree Nag, 2 days ago

Subhasree Nag, 4 days ago

Subhasree Nag, 4 days ago

Subhasree Nag, 5 days ago

Subhasree Nag, 6 days ago


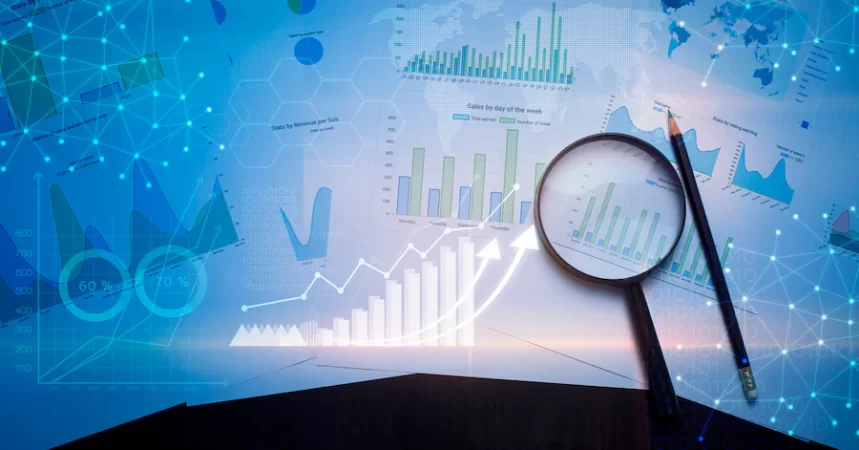
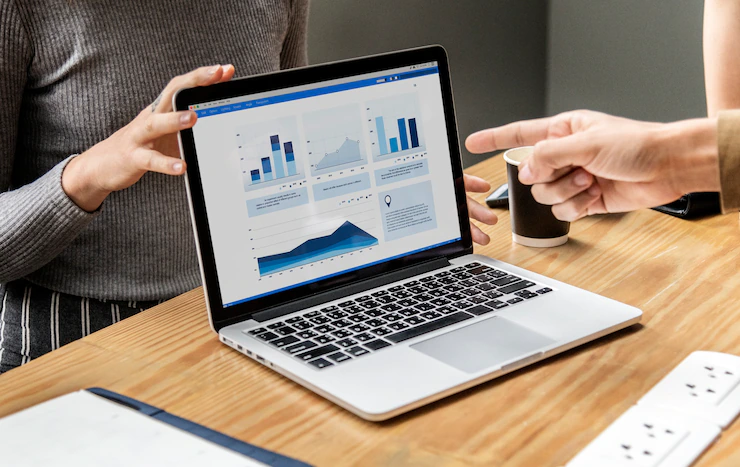
Business analytics is essential for making informed decisions in today’s business world. Businesses can improve their operations, make better strategic decisions, and understand their customers better by analyzing data.
Data analytics can also help companies identify trends and patterns, which can be used to improve products and business operations.
Keep reading to learn about the different types of business analytics and how they can be used to enhance your business.
Business analytics examines large data sets to find trends and patterns. This information can help you make better business decisions, improve your bottom line, and have a competitive advantage.

Business analytics involves the examination of past business performance to help organizations make better decisions for the future.
Through business analytics, organizations can make data-driven decisions about pricing, marketing, product development, and other areas. Business analytics can also help identify areas where improvements can be made. Get data. Get insights. With the right analytics platform. Adverity.
Marketing analytics analyzes data to understand how customers interact with a company’s marketing channels and what impact these interactions have on business outcomes.

Marketing analytics aims to improve marketing performance by understanding which marketing tactics are most effective, identifying opportunities to optimize campaigns, and measuring the return on investment (ROI) of marketing spend.
Prescriptive analytics is a type of business analytics that uses data and mathematical models to provide recommendations for improving business performance.

It differs from other types of business analytics in that it identifies problems and potential solutions and provides specific guidance on how to implement those solutions. This makes prescriptive analytics particularly useful for decision-makers who need to act quickly to stay ahead of the competition.
Prescriptive analytics is based on two key components: first, a large volume of historical data that can be used to identify trends and patterns, and second, sophisticated mathematical models that can analyze this data and generate recommendations.
These recommendations will lay out specific actions that businesses can take to improve their performance or suggestions for business strategy or process changes.
Financial analytics is a type of business analytics that focuses on a company’s financial health. Financial analysts use financial analytics to identify trends and patterns in economic data, forecast future financial performance, and make recommendations to improve a company’s financial health.

Financial analysts use various tools to analyze financial data, including spreadsheets, databases, and software programs designed specifically for financial analysis. They also use different methods to interpret data, such as trend analysis, correlation analysis, and regression analysis.
Financial analytics can be used to answer questions such as:
Online analytical processing (OLAP) and data visualization are two different types of business analytics. OLAP analyzes data to understand past performance and predict future results.

Data visualization takes that information and turns it into graphical representations, which can help decision-makers see patterns and trends more easily. These types of analytics can be used to improve business outcomes, but they are used in different ways.
OLAP is used mainly for understanding what has happened in the past. It can help track how specific actions have affected performance over time and identify relationships between different factors. This information can then be used to predict what might happen in the future.
Data visualization is mainly used for understanding current conditions and making decisions based on that information. It can help identify patterns and trends that would be difficult to see by looking at just numbers or text.
Decision-makers can use data visualizations to get a quick overview of what is happening across all aspects of their business or within specific areas. This allows them to make changes quickly when necessary instead of waiting for reports from individual departments.
Business analytics is essential for companies to make better decisions and increase performance. Through business analytics, organizations can make data-driven decisions about pricing, marketing, product development, and other areas. Business analytics can also help identify areas where improvements can be made.
Additionals:
Mashum Mollah is an entrepreneur, founder and CEO at Viacon, a digital marketing agency that drive visibility, engagement, and proven results. He blogs at BloggerOutreach.io.